SARS-CoV-2, COVID-19 Part 2
All countries need to review their strategies now.
~ Dr. Michael J. Ryan, WHO
It's literally a new world now, so either we adapt to it collectively as one species or only the privileged healthy will be left to live. And the only way to adapt to a new world is to keep working through mistakes, failures and changes, driven by a sense of community.
SARS-CoV-2 proteins. It's some of the best popular science writing we have seen.
SARS-CoV-2 genome sequences from NCBI Virus in FASTA format along with the corresponding full GenBank files. We analyzed it right away, but because life under social distancing sometimes requires some tricky management, we haven't been able to write about it until now.
The 417 full genome sequences were aligned with Muscle version 3.8.31. A number of these sequences were collected from the same location at approximately the same time. This means that the sequences aren't independent samples. If we want to extend the analysis to understand the phylogeny or evolution of the virus we need to carefully select the sequences to get a representative set.
Below, we'll look mostly at sequences from US sites, but the full data set and code is available at the link given at the end of this page.

In addition, several other positions show significant co-variation. We calculated the mutual information between aligned columns in the multiple sequence alignment. The table below shows the column pairs witrh mutual information > 0.5. High mutual information indicates that the positions are co-varying. The table below shows the column pairs with high mutual information. MI is measured in bits.
Positions 17747 and 17858 show the next highest mutual information. In the USA data, the position vary as either C-A or T-G. The holds true for the full data set.

Positions 17747 and 17858 are located in orf1ab. They are part of a helicase peptide, nsp13_ZBD, produced by pp1ab. The full polyprotein, YP_009725308.1, is 7096 amino acids.
We can assume this covariation represents constraints on the viral structure.
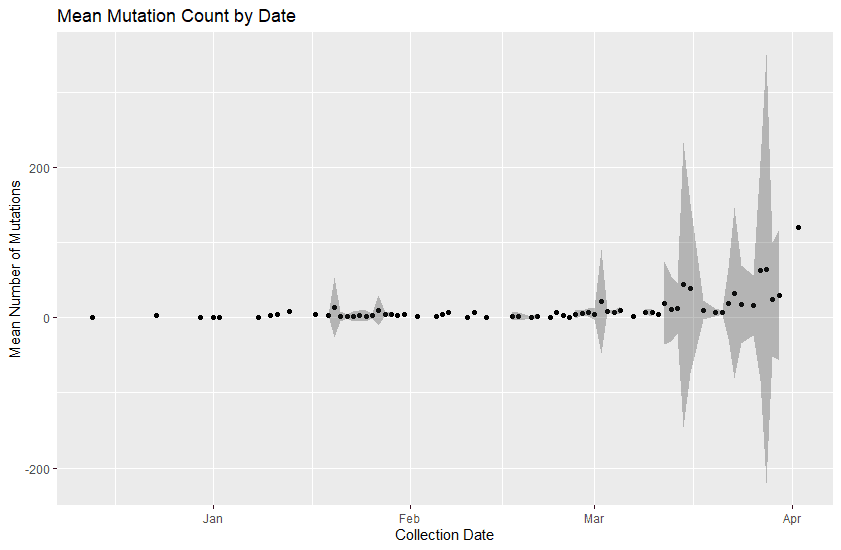
The average number of variations from the reference sequence are increasing with time.

The shaded areas represent +/- two standard deviations from the mean number of mutations for that date. In some cases, we only have one data point, so there is no standard deviation. The last point may be an anomaly. We see what happens when we get more April data.
The following table shows the reference sequence positions with the most variation.
This table shows the amino acid variation of the most varying positions.
Note that there are several non-synonymous mutations (marked with a *).
Of particular interest is the change at nucleotide position 28144. The TTA to TCA codon change changes a Leucine (L) to Serine (S). There is some speculation that this change could make the virus more virulent. However, the evidence is unclear on this point. Position 28144 is in the orf8 protein. Although the function of orf8 in SARS-CoV-2, in SARS-CoV there is evidence that orf8 activates intracellular stress pathways and targets the innate immune response.
The Zhang lab website gives structural prediction models models for most of SARS-CoV-2 proteins. Here's there model for orf8.
~ Dr. Michael J. Ryan, WHO
It's literally a new world now, so either we adapt to it collectively as one species or only the privileged healthy will be left to live. And the only way to adapt to a new world is to keep working through mistakes, failures and changes, driven by a sense of community.
SARS-CoV-2 proteins. It's some of the best popular science writing we have seen.
SARS-CoV-2 genome sequences from NCBI Virus in FASTA format along with the corresponding full GenBank files. We analyzed it right away, but because life under social distancing sometimes requires some tricky management, we haven't been able to write about it until now.
The 417 full genome sequences were aligned with Muscle version 3.8.31. A number of these sequences were collected from the same location at approximately the same time. This means that the sequences aren't independent samples. If we want to extend the analysis to understand the phylogeny or evolution of the virus we need to carefully select the sequences to get a representative set.
Below, we'll look mostly at sequences from US sites, but the full data set and code is available at the link given at the end of this page.
Mutational Landscape of SARS-CoV-2
Previously, we looked at the pattern of mutations in 93 SARS-CoV-2 genomes. We noted that two aligned reference sequence positions 8782 and 28144 showed significant (73%) variation and that the nucleotides vary together. Positions are in the reference sequence. NC_045512, coordinates. In the downloaded data, both positions consist only of T and C . The exception is one sequences with a pair of Y (C/T ) nucleotide calls. Where one has a T, the other has a C. See the full data set for details..

Collection Date
|
Country
|
Count
|
Nucleotide Pairs
|
1/19/2020
|
USA
|
1
|
T-C
|
1/19/2020
|
USA: WA
|
2
|
T-C
|
1/21/2020
|
USA: Illinois
|
1
|
Y-Y
|
1/22/2020
|
USA: AZ
|
1
|
T-C
|
1/22/2020
|
USA: CA
|
1
|
C-T
|
1/23/2020
|
USA: CA
|
1
|
T-C
|
1/25/2020
|
USA: WA
|
2
|
T-C
|
1/27/2020
|
USA: CA
|
1
|
C-T
|
1/28/2020
|
USA: IL
|
1
|
T-C
|
1/29/2020
|
USA: CA
|
3
|
C-T
|
1/29/2020
|
USA: MA
|
1
|
C-T
|
1/31/2020
|
USA: WI
|
1
|
C-T
|
2/6/2020
|
USA: CA
|
1
|
T-C
|
2/10/2020
|
USA: CA
|
1
|
C-T
|
2/11/2020
|
USA: TX
|
1
|
T-C
|
2/17/2020
|
USA
|
8
|
C-T
|
2/18/2020
|
USA
|
6
|
C-T
|
2/20/2020
|
USA
|
2
|
C-T
|
2/21/2020
|
USA
|
5
|
C-T
|
2/23/2020
|
USA: CA
|
1
|
C-T
|
2/24/2020
|
USA
|
3
|
C-T
|
2/24/2020
|
USA: Snohomish County, WA
|
1
|
T-C
|
2/25/2020
|
USA
|
1
|
C-T
|
2/26/2020
|
USA: CA
|
1
|
C-T
|
2/27/2020
|
USA: OR
|
1
|
C-T
|
2/27/2020
|
USA: WA
|
2
|
C-T
|
2/28/2020
|
USA: FL
|
2
|
C-T
|
2/28/2020
|
USA: RI
|
1
|
C-T
|
2/28/2020
|
USA: WA
|
1
|
T-C
|
2/29/2020
|
USA
|
2
|
C-T
|
2/29/2020
|
USA: GA
|
2
|
C-T
|
2/29/2020
|
USA: TX
|
1
|
C-T
|
2/29/2020
|
USA: WA
|
1
|
T-C
|
3/1/2020
|
USA
|
6
|
C-T
|
3/1/2020
|
USA: WA
|
1
|
T-C
|
3/2/2020
|
USA
|
4
|
C-T
|
3/3/2020
|
USA
|
1
|
C-T
|
3/3/2020
|
USA
|
1
|
T-C
|
3/4/2020
|
USA
|
1
|
T-C
|
3/5/2020
|
USA: MN
|
1
|
T-C
|
3/7/2020
|
USA: MN
|
1
|
C-T
|
3/9/2020
|
USA: MN
|
1
|
T-C
|
3/10/2020
|
USA
|
1
|
T-C
|
3/11/2020
|
USA: CA, San Diego County
|
1
|
C-T
|
3/12/2020
|
USA: WA
|
3
|
C-T
|
3/12/2020
|
USA: WA
|
5
|
T-C
|
3/13/2020
|
USA: WA
|
15
|
C-T
|
3/13/2020
|
USA: WA
|
31
|
T-C
|
3/14/2020
|
USA: WA
|
8
|
C-T
|
3/14/2020
|
USA: WA
|
19
|
T-C
|
3/15/2020
|
USA: WA
|
9
|
C-T
|
3/15/2020
|
USA: WA
|
8
|
T-C
|
3/16/2020
|
USA: WA
|
4
|
C-T
|
3/16/2020
|
USA: WA
|
7
|
T-C
|
3/18/2020
|
USA: San Francisco, CA
|
7
|
C-T
|
3/20/2020
|
USA: WA
|
4
|
T-C
|
3/21/2020
|
USA: WA
|
1
|
C-T
|
3/21/2020
|
USA: WA
|
2
|
T-C
|
3/22/2020
|
USA: WA
|
1
|
C-T
|
3/22/2020
|
USA: WA
|
2
|
T-C
|
3/23/2020
|
USA: WA
|
4
|
C-T
|
3/23/2020
|
USA: WA
|
9
|
T-C
|
3/24/2020
|
USA: WA
|
17
|
C-T
|
3/24/2020
|
USA: WA
|
23
|
T-C
|
3/26/2020
|
USA: WA
|
4
|
C-T
|
3/26/2020
|
USA: WA
|
8
|
T-C
|
3/27/2020
|
USA
|
1
|
T-C
|
3/27/2020
|
USA: WA
|
1
|
C-T
|
3/28/2020
|
USA: WA
|
5
|
C-T
|
3/28/2020
|
USA: WA
|
5
|
T-C
|
3/29/2020
|
USA: WA
|
7
|
C-T
|
3/29/2020
|
USA: WA
|
10
|
T-C
|
3/30/2020
|
USA: WA
|
14
|
C-T
|
3/30/2020
|
USA: WA
|
9
|
T-C
|
4/2/2020
|
USA: North Carolina
|
1
|
C-T
|
In addition, several other positions show significant co-variation. We calculated the mutual information between aligned columns in the multiple sequence alignment. The table below shows the column pairs witrh mutual information > 0.5. High mutual information indicates that the positions are co-varying. The table below shows the column pairs with high mutual information. MI is measured in bits.
Nucleotide Pairs
|
MI
|
8782, 28144
|
0.997
|
17747, 17858
|
0.939
|
17747, 18060
|
0.864
|
17858, 18060
|
0.864
|
3037, 14408
|
0.855
|
3037, 23403
|
0.850
|
14408, 23403
|
0.850
|
241, 3037
|
0.801
|
241, 14408
|
0.801
|
241, 23403
|
0.797
|
8782, 18060
|
0.644
|
18060, 28144
|
0.644
|
1059, 25563
|
0.641
|
8782, 17747
|
0.609
|
8782, 17858
|
0.609
|
17747, 28144
|
0.609
|
17858, 28144
|
0.609
|
3037, 25563
|
0.551
|
14408, 25563
|
0.551
|
23403, 25563
|
0.546
|
241, 25563
|
0.515
|
Positions 17747 and 17858 show the next highest mutual information. In the USA data, the position vary as either C-A or T-G. The holds true for the full data set.

Collection Date
|
Country
|
Count
|
Nucleotide Pairs
|
1/19/2020
|
USA
|
1
|
C-A
|
1/19/2020
|
USA: WA
|
2
|
C-A
|
1/21/2020
|
USA: Illinois
|
1
|
C-A
|
1/22/2020
|
USA: AZ
|
1
|
C-A
|
1/22/2020
|
USA: CA
|
1
|
C-A
|
1/23/2020
|
USA: CA
|
1
|
C-A
|
1/25/2020
|
USA: WA
|
2
|
C-A
|
1/27/2020
|
USA: CA
|
1
|
C-A
|
1/28/2020
|
USA: IL
|
1
|
C-A
|
1/29/2020
|
USA: CA
|
3
|
C-A
|
1/29/2020
|
USA: MA
|
1
|
C-A
|
1/31/2020
|
USA: WI
|
1
|
C-A
|
2/6/2020
|
USA: CA
|
1
|
C-A
|
2/10/2020
|
USA: CA
|
1
|
C-A
|
2/11/2020
|
USA: TX
|
1
|
C-A
|
2/17/2020
|
USA
|
8
|
C-A
|
2/18/2020
|
USA
|
6
|
C-A
|
2/20/2020
|
USA
|
2
|
C-A
|
2/21/2020
|
USA
|
5
|
C-A
|
2/23/2020
|
USA: CA
|
1
|
C-A
|
2/24/2020
|
USA
|
3
|
C-A
|
2/24/2020
|
USA: Snohomish County, WA
|
1
|
T-G
|
2/25/2020
|
USA
|
1
|
C-A
|
2/26/2020
|
USA: CA
|
1
|
C-A
|
2/27/2020
|
USA: OR
|
1
|
C-A
|
2/27/2020
|
USA: WA
|
2
|
C-A
|
2/28/2020
|
USA: FL
|
2
|
C-A
|
2/28/2020
|
USA: RI
|
1
|
C-A
|
2/28/2020
|
USA: WA
|
1
|
T-G
|
2/29/2020
|
USA
|
2
|
C-A
|
2/29/2020
|
USA: GA
|
2
|
C-A
|
2/29/2020
|
USA: TX
|
1
|
C-A
|
2/29/2020
|
USA: WA
|
1
|
T-G
|
3/1/2020
|
USA
|
6
|
C-A
|
3/1/2020
|
USA: WA
|
1
|
T-G
|
3/2/2020
|
USA
|
4
|
C-A
|
3/3/2020
|
USA
|
2
|
C-A
|
3/4/2020
|
USA
|
1
|
C-A
|
3/5/2020
|
USA: MN
|
1
|
T-G
|
3/7/2020
|
USA: MN
|
1
|
C-A
|
3/9/2020
|
USA: MN
|
1
|
T-G
|
3/10/2020
|
USA
|
1
|
T-G
|
3/11/2020
|
USA: CA, San Diego County
|
1
|
C-A
|
3/12/2020
|
USA: WA
|
3
|
C-A
|
3/12/2020
|
USA: WA
|
5
|
T-G
|
3/13/2020
|
USA: WA
|
15
|
C-A
|
3/13/2020
|
USA: WA
|
31
|
T-G
|
3/14/2020
|
USA: WA
|
9
|
C-A
|
3/14/2020
|
USA: WA
|
18
|
T-G
|
3/15/2020
|
USA: WA
|
9
|
C-A
|
3/15/2020
|
USA: WA
|
8
|
T-G
|
3/16/2020
|
USA: WA
|
4
|
C-A
|
3/16/2020
|
USA: WA
|
7
|
T-G
|
3/18/2020
|
USA: San Francisco, CA
|
7
|
C-A
|
3/20/2020
|
USA: WA
|
4
|
T-G
|
3/21/2020
|
USA: WA
|
1
|
C-A
|
3/21/2020
|
USA: WA
|
2
|
T-G
|
3/22/2020
|
USA: WA
|
1
|
C-A
|
3/22/2020
|
USA: WA
|
2
|
T-G
|
3/23/2020
|
USA: WA
|
5
|
C-A
|
3/23/2020
|
USA: WA
|
8
|
T-G
|
3/24/2020
|
USA: WA
|
18
|
C-A
|
3/24/2020
|
USA: WA
|
22
|
T-G
|
3/26/2020
|
USA: WA
|
4
|
C-A
|
3/26/2020
|
USA: WA
|
8
|
T-G
|
3/27/2020
|
USA
|
1
|
C-A
|
3/27/2020
|
USA: WA
|
1
|
C-A
|
3/28/2020
|
USA: WA
|
5
|
C-A
|
3/28/2020
|
USA: WA
|
5
|
T-G
|
3/29/2020
|
USA: WA
|
7
|
C-A
|
3/29/2020
|
USA: WA
|
10
|
T-G
|
3/30/2020
|
USA: WA
|
14
|
C-A
|
3/30/2020
|
USA: WA
|
9
|
T-G
|
4/2/2020
|
USA: North Carolina
|
1
|
C-A
|
Positions 17747 and 17858 are located in orf1ab. They are part of a helicase peptide, nsp13_ZBD, produced by pp1ab. The full polyprotein, YP_009725308.1, is 7096 amino acids.
 |
| https://zhanglab.ccmb.med.umich.edu/COVID-19/ |
We can assume this covariation represents constraints on the viral structure.
The average number of variations from the reference sequence are increasing with time.
The shaded areas represent +/- two standard deviations from the mean number of mutations for that date. In some cases, we only have one data point, so there is no standard deviation. The last point may be an anomaly. We see what happens when we get more April data.
Amino Acid Substitutions
The following table shows the reference sequence positions with the most variation.
reference columns
|
A
|
C
|
G
|
T
|
insertions
|
other
|
consensus
|
consensus %
|
alt
|
28144
|
0
|
147
|
0
|
165
|
0
|
1
|
T
|
52.88461538
|
C
|
8782
|
0
|
165
|
0
|
147
|
0
|
1
|
C
|
52.88461538
|
T
|
18060
|
0
|
189
|
0
|
124
|
0
|
0
|
C
|
60.38338658
|
T
|
17858
|
193
|
0
|
120
|
0
|
0
|
0
|
A
|
61.66134185
|
G
|
17747
|
0
|
193
|
0
|
120
|
0
|
0
|
C
|
61.66134185
|
T
|
241
|
0
|
234
|
0
|
68
|
5
|
6
|
C
|
76.22149837
|
T
|
14408
|
0
|
244
|
0
|
69
|
0
|
0
|
C
|
77.95527157
|
T
|
3037
|
0
|
244
|
0
|
69
|
0
|
0
|
C
|
77.95527157
|
T
|
23403
|
244
|
0
|
68
|
0
|
0
|
1
|
A
|
78.20512821
|
G
|
25563
|
0
|
0
|
254
|
59
|
0
|
0
|
G
|
81.15015974
|
T
|
1059
|
0
|
258
|
0
|
55
|
0
|
0
|
C
|
82.42811502
|
T
|
This table shows the amino acid variation of the most varying positions.
reference columns
|
codons
|
aas
|
alt_codons
|
alt_aas
|
products
|
notes
|
* 28144
|
TTA
|
L
|
TCA
|
S
|
ORF8 protein
|
|
8782
|
AGC
|
S
|
AGT
|
S
|
nsp4
|
nsp4B_TM; contains transmembrane domain 2 (TM2); produced by both
pp1a and pp1ab
|
18060
|
CTC
|
L
|
CTT
|
L
|
3'-to-5' exonuclease
|
nsp14A2_ExoN and nsp14B_NMT; produced by pp1ab only
|
* 17858
|
TAT
|
Y
|
TGT
|
C
|
helicase
|
"nsp13_ZBD, nsp13_TB, and nsp_HEL1core; zinc-binding domain
(ZD), NTPase/helicase domain (HEL), RNA 5'-triphosphatase; produced by pp1ab
only"
|
* 17747
|
CCT
|
P
|
CTT
|
L
|
helicase
|
"nsp13_ZBD, nsp13_TB, and nsp_HEL1core; zinc-binding domain
(ZD), NTPase/helicase domain (HEL), RNA 5'-triphosphatase; produced by pp1ab
only"
|
* 241
|
CGT
|
R
|
TGT
|
C
|
||
14408
|
CTA
|
L
|
TTA
|
L
|
RNA-dependent RNA polymerase
|
nsp12; NiRAN and RdRp; produced by pp1ab only
|
* 3037
|
TTC
|
F
|
TTT
|
F
|
nsp3
|
"former nsp1; conserved domains are: N-terminal acidic (Ac),
predicted phosphoesterase, papain-like proteinase, Y-domain, transmembrane
domain 1 (TM1), adenosine diphosphate-ribose 1''-phosphatase (ADRP); produced
by both pp1a and pp1ab"
|
* 23403
|
GAT
|
D
|
GGT
|
G
|
surface glycoprotein
|
structural protein; spike protein
|
* 25563
|
CAG
|
Q
|
CAT
|
H
|
ORF3a protein
|
|
* 1059
|
ACC
|
T
|
ATC
|
I
|
nsp2
|
produced by both pp1a and pp1ab
|
Note that there are several non-synonymous mutations (marked with a *).
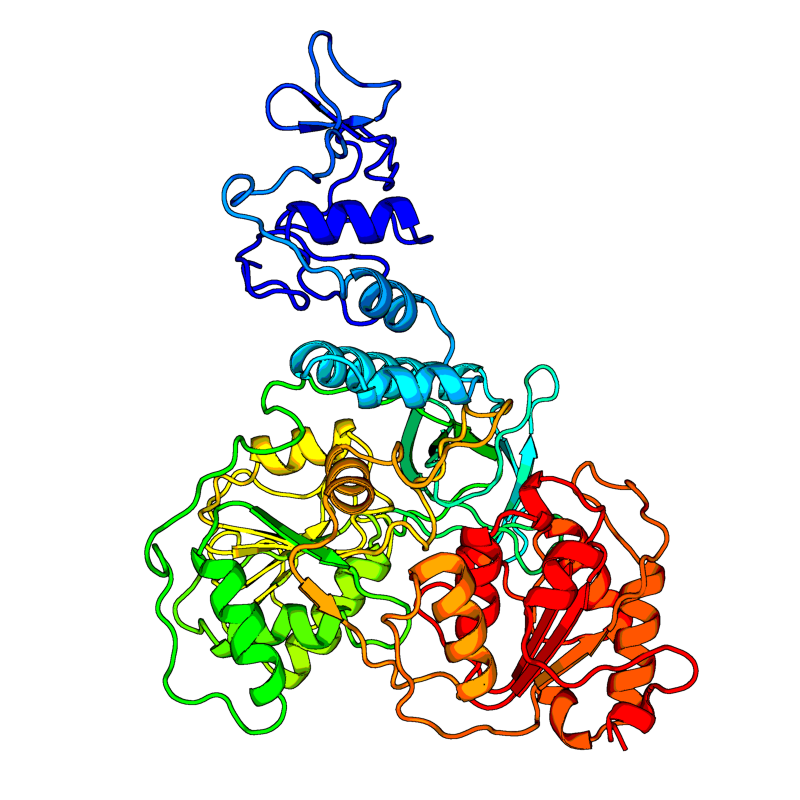
Of particular interest is the change at nucleotide position 28144. The TTA to TCA codon change changes a Leucine (L) to Serine (S). There is some speculation that this change could make the virus more virulent. However, the evidence is unclear on this point. Position 28144 is in the orf8 protein. Although the function of orf8 in SARS-CoV-2, in SARS-CoV there is evidence that orf8 activates intracellular stress pathways and targets the innate immune response.
The Zhang lab website gives structural prediction models models for most of SARS-CoV-2 proteins. Here's there model for orf8.
 |
| orf8 structural prediction |
You can find the code and the data for these tables here.


Comments
Post a Comment