Breakthroughs

Vaccines, masks, and social distancing provide protection against COVID-91. The protection isn't prefect however. Even being fully vaccinated doesn't guarantee that you won't get sick. It does  significantly reduce your chances of being seriously ill, i.e. hospitalized or dead.

The CDC provides a dashboard where you can visualize cases and hospitalizations. If you're like me, you want to get the raw data and see for yourself. The CDC provides data on cases and vaccinations in a variety of formats at https://data.cdc.gov/Public-Health-Surveillance/Rates-of-COVID-19-Cases-or-Deaths-by-Age-Group-and/3rge-nu2a and https://data.cdc.gov/Public-Health-Surveillance/Rates-of-COVID-19-Cases-or-Deaths-by-Age-Group-and/d6p8-wqjm.

On January 5 2022, I downloaded a data file with 630 observations of case and death summaries from COVID-19 from the first site above. 

Here's what the data looks like after it has been loaded into R.

> head(vac_status)
  outcome    month MMWR.week Age.group Vaccine.product Vaccinated.with.outcome Fully.vaccinated.population Unvaccinated.with.outcome
1    case 04 - APR        14     12-17       all_types                       6                       31887                     26558
2    case 04 - APR        14     18-29       all_types                     565                     2191917                     63365
3    case 04 - APR        14     30-49       all_types                    1583                     6223351                     79718
4    case 04 - APR        14     50-64       all_types                    1284                     6110352                     42739
5    case 04 - APR        14     65-79       all_types                    1424                    12541793                     12450
6    case 04 - APR        14       80+       all_types                     682                     4347953                      3040
  Unvaccinated.population Crude.vax.IR Crude.unvax.IR Crude.IRR Age.adjusted.vax.IR Age.adjusted.unvax.IR Age.adjusted.IRR
1                14826337     18.81645       179.1272  9.519714                  NA                    NA               NA
2                26026610     25.77652       243.4624  9.445120                  NA                    NA               NA
3                33943622     25.43646       234.8541  9.232974                  NA                    NA               NA
4                19406307     21.01352       220.2325 10.480516                  NA                    NA               NA
5                 6448344     11.35404       193.0728 17.004771                  NA                    NA               NA
6                 2270061     15.68554       133.9171  8.537614                  NA                    NA               NA
  Continuity.correction
1                     0
2                     0
3                     0
4                     0
5                     0
6                     0
>  

I wanted to compare case and deaths based on vaccine status. Unfortunately, the CDC data for cases only goes up to mid November and mid October for deaths. This means that the data missed much of the Omicron surge. That was my original interest. Perhaps there will be more data in the near future and I'll update the results.

It's relatively easy to visualize the contrast between vaccination status. It can give a clear view of how being vaccinated influences your chance of being ill.

First let's look at cases by data and vaccination status. The data file stores data as epidemiological weeks, MMWR.week in the dataframe. You can convert MMWR.week to dates using epi_week_date from the epical package. There may be some concerns about using epicalc because it manipulates the global environment. See this post. I'm only using the date function.

To install epical:

> library(remotes)
> remotes::install_github("chrismerkord/epical")
 

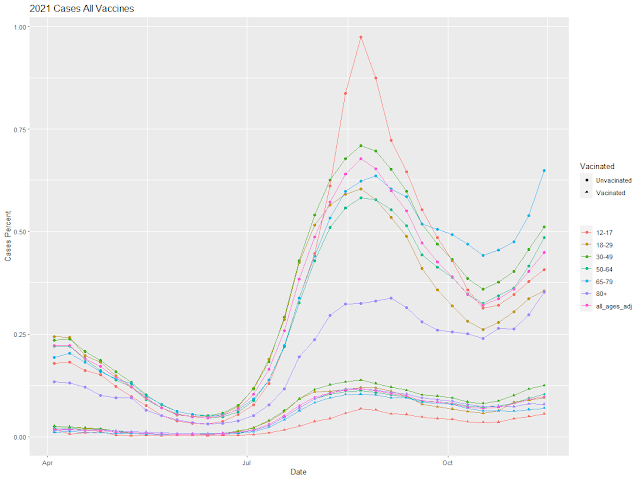
Here's the case data by date and vaccination status as percent of the populations.

The absolute percents are quite low, but the contrast between vaccinated and unvaccinated status is impressive.

Deaths based on vaccination status is similarly impressive.


Age affects your chances of having a positive case or dying.


The moral of all of this is get vaccinated. It will help protect you, your family, and health care workers.

The code to process the CDC data is available at https://github.com/analytic-garden/COVID-19-Breakthrough-cases 

No comments:

Post a Comment