Posts

September BA Update

Image
 President Biden says the pandemic is over . Maybe, but still ~400 Americans are dying each day from COVID-19 and excess deaths are still 10% above “expected.” It seems SARS-CoV-2 is not done with us. See the wonderful  Your Local Epidemiologist blog for details. In fact, I would like to put in a plug for Katelyn Jetelina's blog . It's one of the best sources for explanations of the current epidemiological situations that I have encountered. On September 13 2022, I downloaded a metadata file from  GISAID  containing 13,061,086 rows and 22 columns.  For this post, I take a brief look at the progress of the BA variants in the US. It's hard to know if the GISAID data gives a representative sample of the COVID-19 situation as, like other dats sources, it's likely that the actual situation is underreported. Still, the data you have is the dats that you have. Here's what the data shows for variants of concern. As we have seen before the Omicron variant is firm...
Speed Demons

This post describes a little experiment in loading large file with Julia, Python, and R. On September 13, 2022, I downloaded a metadata file from GISAID . The file 13,061,086 rows and 22 columns. As a file for the PC, it's big. My usual approach to analyzing GISAID data is using a combination of R for counting and plotting variables such as linages over time and using Python, particularly BioPython, for manipulating sequence data.  When using R, I tend to use the tidyverse  tools for manipulating tabular data. Transforming dataframes by piping then through functions seems like a natural approach. Julia, the other hand, is often fast enough that writing simple loops to manipulate data is feasible and can lead to simpler more readable code. Loading a file with more than 13 million rows is slow in R. I wondered if Julia or Python/Pandas could do better.  What follows is an unscientific exercise in reading a large tab delimited file. All the tests were run on a PC with a...

Swimming Upstream

 For a recent project I needed sequence regions upstream (preceding then 5' end of the gene) of a set of orthologous genes. The orthologs for a gene of interest are obtained from  https://www.ncbi.nlm.nih.gov/gene . For example, searching for  JAK2 orthologs  at that site yields a table of JAK2 genes for a large number of species. After selecting species, the ortholog table can be downloaded. Fetching Genomes Since I wanted to analyze a number of different genes, I decided to automate the process of getting the upstream regions. The first step was to fetch the GenBank records for the genomes of the selected species. The GenBank IDs for each species are included in the downloaded ortholog table. Fetching genomes is straightforward, if a bit slow. It uses Pandas to read the ortholog Table from NCBI and BioPython.Entrez to download the complete GenBank record for the genome. def main (): args = GetArgs() genome_path = args . genome_path ortholog_tab...

Getting a Window from Windows

 I don't usually program specifically for Windows. I run Windows out of necessity, but almost all of my recent programming work is in Python, Julia, or R using WSL-2. Windows makes a reasonable desktop environment Linux development. I would consider ditching Windows entirely, but I have to support our local church and family, all of whom used Windows. Recently, I was asked to develop a simple app that ran on a dedicated Windows notebook connected to a monitoring device. The task was relatively easy, capture a specified Window and save an image of it to a file. The target window title, the output location, and the image type were to be stored in a parameter file that was to be located in a common directory. This sort of thing would be relatively easy in Python, but I was not allowed to install Python on the notebook. The notebook did have Java installed so that was an option. Using C++ and creating a Windows .exe file was also a reasonable choice. In my misspent youth, I did a lot o...

Mixed Models Part 2

Image
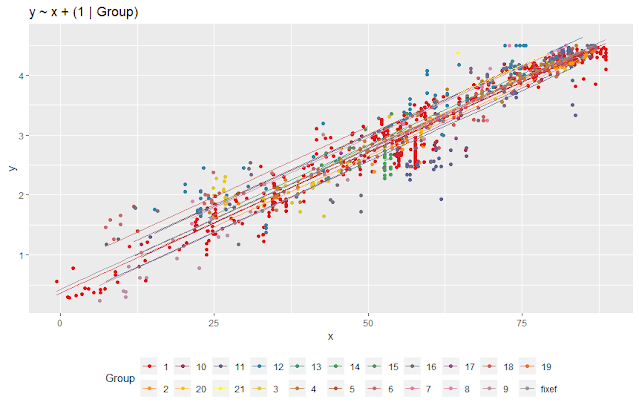
 In a previous post , we looked at four different linear models for a collection of data where besides x and y values, the data was qualifies by an additional factor called a Group . In those models, we either assumed that the difference in groups had no effect on the model, models 1 and 2, or that the groups were independent, and we could estimate their effects on slope and intercept individually. A compromise between these two approaches is the mixed-effect model , sometimes called a multilevel linear model or a random effects model. The difference is that the groups are assumed to be a random sample from a larger population of groups measuring the same kinds of data. In other words, are the groups we see all the groups we will see or is the data a sample from the world of possible groups? A Linear Model The simplest mixed model is similar to model 2 from the previous post. In this model we expect the Group value to affect the intercept of the linear model.  \[\begin{a...